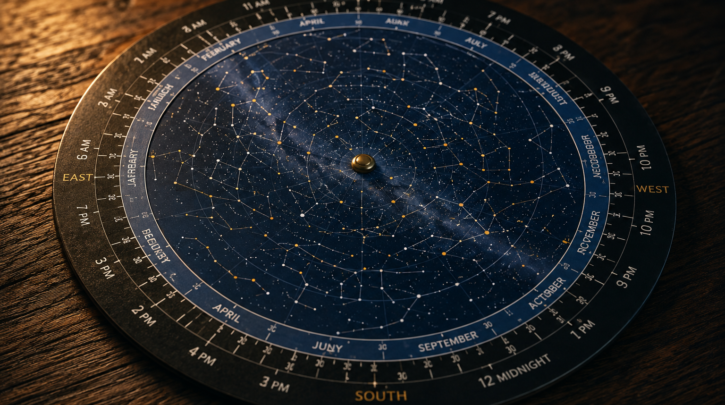

A star chart, or planisphere, is a rotating map of the sky that shows exactly what’s visible from a given latitude at any date and time. Once you know how to orient one, it turns a confusing dome of stars into a navigable map — and it works even with no signal or battery, unlike an app.
How a Planisphere Works
A physical planisphere consists of a base disk printed with the visible stars and a rotating overlay with a cutout window and a date scale around the edge. Lining up the current date on the base with the current time on the overlay reveals, through the cutout window, the exact section of sky visible right now. Because it’s built for a specific latitude range, using one meant for a different part of the world will show a noticeably wrong sky.
Orienting the Chart to the Real Sky
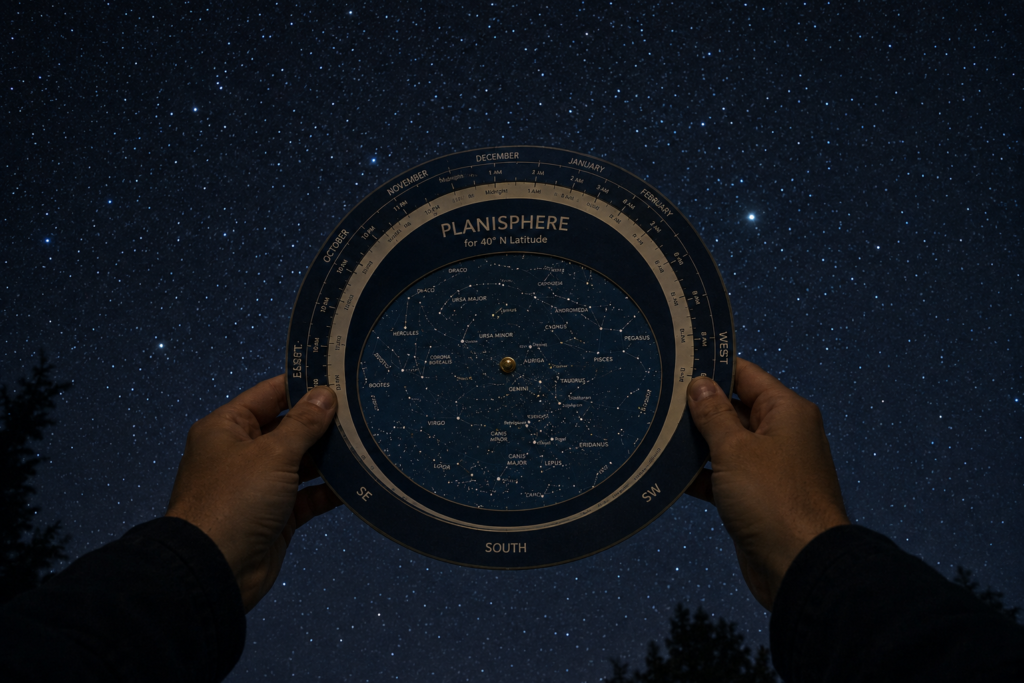
The chart’s edge is labeled with compass directions — north, south, east, west. To use it, hold the chart overhead and rotate it so the direction you’re facing on the chart matches the direction you’re actually facing outside; the stars near the edge of the chart correspond to the horizon in that direction, while the center of the chart represents the point directly overhead, called the zenith.
Understanding Magnitude
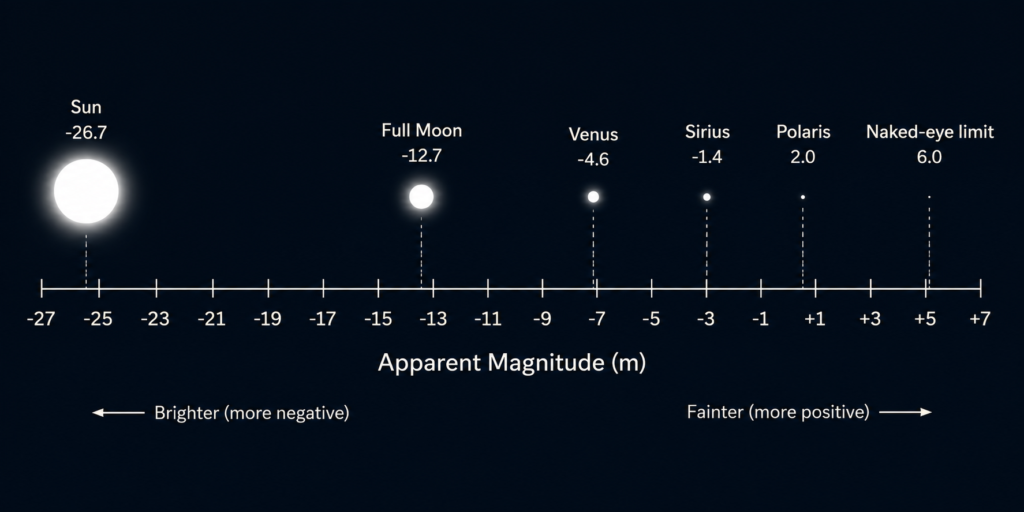
Star charts label brightness using magnitude, a scale where lower (and even negative) numbers mean brighter objects — it’s counterintuitive at first, but it’s a fixed astronomical convention worth learning once. Each step of about 5 magnitudes represents roughly a 100-fold difference in brightness. In a genuinely dark sky, the naked eye can pick out stars down to about magnitude 6; in a typical suburb, light pollution often pushes that limit to magnitude 4 or brighter, hiding a large share of what a chart shows.
| Object | Approximate Magnitude |
|---|---|
| Sun | -26.7 |
| Full Moon | -12.7 |
| Venus (at brightest) | -4.6 |
| Sirius (brightest star) | -1.4 |
| Polaris (North Star) | 2.0 |
| Naked-eye limit, dark sky | ~6.0-6.5 |
| Naked-eye limit, bright suburb | ~4.0-4.5 |
Right Ascension and Declination
More detailed charts and apps also show right ascension and declination — the sky’s equivalent of longitude and latitude, used to pinpoint an object’s exact position regardless of the observer’s location or the time of night. Beginners don’t need to work with these coordinates directly, but recognizing them on a chart or in a telescope’s go-to system helps make sense of how objects are cataloged and located precisely.
Paper Chart vs. App
A physical planisphere never needs charging or signal and works anywhere, which makes it a reliable backup, especially at a remote dark-sky site. An app or planetarium program, on the other hand, updates automatically for your exact location and time and can show far more detail and fainter objects than a paper chart’s limited star count. Most serious stargazers end up using both — an app for planning and detail, a paper chart as a no-battery backup; see our stargazing apps guide for options.
Reading a Chart Alongside a Telescope’s Go-To System
If you’re using a telescope or smart telescope with an automated go-to system, you may not need to read a chart in the field at all — but understanding the underlying chart concepts still helps you plan a session, choose targets, and understand what the telescope is doing; see our beginner telescopes guide for how automated systems compare to manual star-hopping.
Common Beginner Mistakes
The most common mistake is holding the chart at the wrong angle — it’s meant to be held overhead, not out in front of you like a book, since it’s mapping the dome of sky above rather than a flat scene ahead. The second is forgetting that a chart only shows a moment in time; stars that were just above the eastern horizon at 8pm will have moved noticeably by 10pm, so re-checking the chart periodically through a longer session keeps it accurate.
Practicing Indoors First
Before your first outdoor session, it’s worth practicing the mechanics of setting the date and time on a planisphere, or getting comfortable with an app’s interface, somewhere well-lit and comfortable. Fumbling with an unfamiliar chart or app in the dark, cold, and often frustrating conditions of an actual observing session is a common way beginners get discouraged before the chart has a chance to prove useful.
A few minutes of practice indoors saves a lot of frustration outside, and it means your first real session is spent looking at the sky rather than wrestling with an unfamiliar tool.